Angular-Google-Chart Image Overlays
As promised in my last post, I did something slightly designer-y as something for show-and-tell at CodePenTo next Wednesday. Also, I’d like to note that this is my first post with pretty pictures. Enjoy!
Image Overlays
I first stumbled upon this feature trying to replicate the annotation feature available in Google Analytics. At first glance I thought they were just dressed-up chart annotations. The name is the same after all, right?
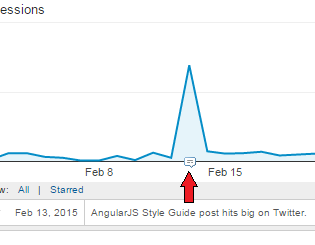 Fig. 1
Annotations in Google Analytics turn out not to use Google Charts Annotations.
Fig. 1
Annotations in Google Analytics turn out not to use Google Charts Annotations.
It turns out there was no way to make an annotation look quite like the feature I was looking for. But that’s okay, there is still a fairly straight-forward way to do it. And I’ll even save you from 2 hours of head-scratching that I did.
There is a set of examples on how to do this without AngularJS in the Charts API Documentation.
Chart Layout Interface
The basic mechanism provided by the Charts API to accomplish this task is the
Chart Layout Interface. It is accessible on supported charts by calling
getChartLayoutInterface(). This is called on the actual chart instance, which
you can get in angular-google-chart by implementing an on-ready handler to
retrieve the ChartWrapper instance, and then getting the chart instance from
that.
(function(){
  angular.module('chart-example')
    .controller('ExampleController', ExampleController);

  ExampleController.$inject = ['$scope', 'chartObject'];

  function ExampleController($scope, chartObject){

    $scope.readyHandler = function (chartWrapper) {
    var chart, layoutInterface;
    chart = chartWrapper.getChart();
    layoutInterface = chart.getChartLayoutInterface();
  };

  // Chart Object added with Dependency Injection
  // Convenient for examples.
  $scope.chart = chartObject;
  }
})();
<!--
  Important Note: chartWrapper is injected by name here, so spell it correctly.
-->
<div google-chart chart="chart" on-ready="readyHandler(chartWrapper)"></div>
So what does this layoutInterface do for us? Basically, it allows us to retrieve pixel coordinates for positions relative to the actual chart data. In the Google Analytics example, the x-axis is a date type. So in that case you could use the layoutInterface to take a given date, and get the x-coordinates of that date in the chart area.
The layoutInterface API works something like this…
var layoutInterface = chartWrapper.getChart().getChartLayoutInterface();

// Get the X location of February 13, 2015
var x = layoutInterface.getXLocation(new Date(2015,1,13));

// Get the Y location of the value 175
var y = layoutInterface.getYLocation(175);

// setup css values to position an element at those coords with ng-style
var style = {
  position: 'absolute',
  left: x + 'px',
  top: y + 'px'
}
You can also work the other way around. Let’s say we have some kind of pointer event with an x and y value. We can work backwards from that the get the chart data values for those coordinates.
var hValue = layoutInterface.getHAxisValue(x);
var vValue = layoutInterface.getVAxisValue(y);
The layoutInterface also has methods for getting bounding boxes of the entire chart, and for the chart area.
All Together Now
Here’s my example, on CodePen for the first time ever. It’s kind of subtle, but
the weather icons on the top of the chart are taken from a column in the chart’s
DataTable. When the chart is ready, an array of objects with the necessary
information to render the images in place is created from the chart data. An
ng-repeat inside the same container element as the chart directive renders the
actual image tags.
See the Pen Angular-Google-Chart Image Overlay by Nicholas Bering (@nbering) on CodePen.
Gotcha!
I wasted a couple of hours trying to get everything to render in the right
location. The x and y values returned by the layout interface are relative to
the chart’s container element. But that doesn’t necessarily mean your css
absolute values will be rendered from the same reference point. Make sure the
element above the chart directive has position: relative;. This will force the
browser to use that element as the reference point when rendering your overlay.